Bias is often seen in a negative light, but that's a conversation for another day. Today, I'm not here to argue whether my bias is good or bad. I'm here to own it. And what I'm unapologetically biased toward is GIS. In one of my recent posts, I described this discipline as one of those cool kids who seem effortlessly good at everything. The kind that leaves people wondering, 'How do they even do it?’
In the fight against climate change, keeping tabs on emissions remains one of the toughest things to do, but remember I have my “jack of trades, and master of all” yes don’t forget I said I’m unapologetic about my bias on how the kool kid solves almost everything.
We have resources such as Carbon Mapper which uses hyperspectral satellites to detect methane and CO₂ emissions at the facility level and identifying super-emitters. Coupling this with GIS we transform satellite data into layered maps, turning invisible threats to visual insights and that is very helpful as we are shown not just where emissions are happening, but why.
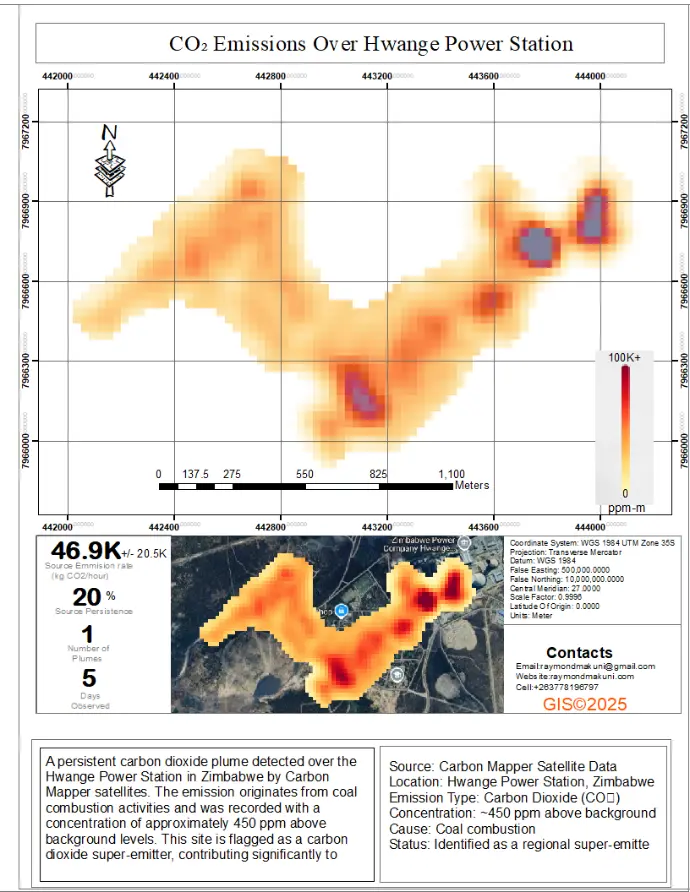
With continued research and innovation, it is my hope and belief that we are moving toward a future where tracking carbon and methane emissions becomes not only accurate but easy or rather effortless. Technologies like GIS and remote sensing are helping us break those barriers. I prepared this map which shows a persistent carbon dioxide plume that was detected over the Hwange Power Station in Zimbabwe by Carbon Mapper satellites. The emission originates from coal combustion activities and was recorded with a concentration of approximately 450 ppm above background levels. This site is flagged as one of the carbon dioxide super-emitter in the region.